NCBA&E
Subject: Strategic Management
Topic:
Nishat Mills ltd
Submitted to: Sir Muhammad Ishtiaq Ishaq
Submitted by:
Khurram Shahzad
Muhammad Ijaz
Sohaib Dilawr
Mansab Iqbal
Najeeb Ullah
Ijazmeo86@gmail.com
Nishat Mills ltd
Table of Contents
Topic
|
Page No.
|
|
Executive Summary
|
03
|
|
Introduction of Organization |
08
|
|
Mission &
Vision Statement
|
10
|
|
Organizational Structure |
13
|
|
Strategic Analysis
|
14
|
|
Corporate Level Strategies
|
14
|
|
Business
Level Strategies
|
14
|
|
Functional Level Strategies
|
14
|
|
SWOT Analysis
|
19
|
|
EFE Matrix
|
19
|
|
IFI Matrix
|
20
|
|
BCG Matrix
|
23
|
|
TOWS Matrix
|
25
|
|
Quantitative
Strategic Planning Matrix
|
28
|
|
Porter’s Five Forces Model
|
30
|
|
Chart of Strategic
Business Unit(s) of this Organization
|
32
|
|
Issues in Current
Strategies
|
33
|
|
Proposed Recommendations |
34
|
|
Conclusions
|
35
|
EXECUTIVE SUMMARY
Nishat
has grown from a cotton export house into the premier business group of
Pakistan with 5 listed companies, concentrating on 4 core businesses; Textiles,
Cement, Banking and Power Generation. Today, Nishat is considered to be at part
with multinationals operating locally in terms of its quality products and
management skills.
I
have recently done my internship in Nishat textile Mills Limited, in which I
got training from each of its department. The internship basically revolved
around the product knowledge training. The system, the style of working &
the commitment of the employees in NML is really exemplary. The difference
between the success & failure is doing things right and doing things nearly
right, & NML has always tried for success & that is why it is known to
be one of the leading organizations in Pakistan. Irrespective of all these
positive points of Nishat Mills Limited, I have noticed a few areas where the
improvement can really increase the efficiency of NML.
In
this report I have given a very brief review of what I have seen during our
internship I have mentioned all these as I have made an internship as according
to the schedule. I also mentioned about the Textile industry in Pakistan. Then
I give the introduction of organization. Then I have discussed about my
learning in the whole internship that is all about the Textile Terminologies
and process of different departments. Then I have done Financial, SWOT and PEST
analysis. I have made it possible to write each and every thing that I have learnt
there. I have all my practical efforts in the form of this manuscript that’s
the asset for my future career.
HISTORY OF PAKISTAN TEXTILE INDUSTRY
Increase
in the cotton production and expansion of textile industry has been impressive
in Pakistan since 1947. Cotton – bales increase from 1.1 million bales in 1947
to ten million bales by 2000. Number of mills increased from 3 to 600 and
spindles from about 177,000 to 805 million similarly looms and finishing units
increased but not in the same proportion. It employs 50% of industrial labour
force and earns 65% foreign exchange of total exports. Pakistan’s textile
industry experts feel that Pakistan has fairly large size textile industry and
60-70% of machines need replacement for the economic and quality production of
products for a highly competitive market. But unfortunately it does not have
any facility for manufacturing of textile machinery of balancing modernization
and replacement (BMR) in the textile mills which need to think about joint
ventures for the production of complete spinning units with china, Italy and
production of shuttle less looms (Projectile) with Korea, Taiwan and Italy.
Cotton
textile industry has been premier industry in Pakistan and a major source of
export earning and employment. It also helps in value addition to the
manufacturing sector of the economy. During the six years between 1993 and
1998, production of yarn (in quantity terms) registered a steady annual growth
rate of 302% in Bangladesh and 405% in India. On the contrary, Pakistan
registered a growth rate of 101% per annum in yarn production although it
ranked third after China and India in the global yarn production during the
same six years. In exports, while Taiwan, India and the republic of Korea
registered an annual increase of 18.1%, 27.7% and 5.4% respectively during
1993-1998, Pakistan registered a negative growth of 4.8% one important
development was that till 1997, Pakistan was the world’s largest exporter yarn
followed by India. However, in 1998, India gained the NO 1 position, leaving
Pakistan at NO 2 In the case of cotton cloth production, a number of Asian
countries have been emerging in the international market to compete with
Pakistan. These countries are Bangladesh, India, Taiwan, Indonesia, Thailand,
Turkey, Sri Lanka and Iran. The latest available date on overall export
performance of The above-mentioned presentation in the context of international
scenario highlights the adverse position of Pakistan’s textile industry. when
is likely to continue
further following the full implementation of WTO agreement from 2005
onwards when an era of free
trade will start
globally. Notwithstanding the above fact, current stagnation in the local
textile industry can be overcome through efforts, consistent with charges occurring
in the international market. It must be appreciated that all successive
governments since the birth of cotton textile industry in Pakistan have been
encouraging the textile exporters to penetrate into new market and also to
broaden the base of exportable commodities by including value added textile
goods so that reliance on exports of cotton, cotton yarn and coarse fabrics
gradually become minimal.
Reflecting
on the state of affairs, Abid Chinoy, Pakistan cloth merchants Association
(PCMA) Chairman, Appreciated government’s efforts to encourage new exports and
finding new markets, which need aggressive export marketing. The steps taken on
the monetary front, such as the frequent devaluation of Pak rupee in terms of
dollar could not improve the cost competitiveness of exportable products due to
increase in prices of the local and imported inputs of the local textile
industry, and also due to inelastic demand for the Pakistan’s exports. It has
been rightly mentioned in the latest state bank of Pakistan’s annual report
(FY01) that, “Over the years Pakistan’s exports receipts have been vulnerable
on account of the narrow base of exportable items, concentrated markets and low
value addition ‘this indicated that the growth in the country’s overall
exports, including textile products which contributed more then 60% of total
export receipts each year, could to be related some cosmetic and ad hoc measure
like devaluation of Pak rupee and concession export credits. The first textile
commission, which was constituted by the first material law government in 1960
had, inter-alia, recommended that an economic size textile unit should
preferably have 25,000 spindles and 500 looms. No new mill with only 12,500
spindles and without looms should be sanctioned. However, no need was paid to
the advice by the sanctioning authorities with the result that an excess
capacity had tented to build up in the spinning sector.
During
the period 1973 to December 1992, some 71 spinning units with 1,136, 835
spindles, 6,600 rotors ands 7,329 looms were closed down. In 1992, a foreign
consultant form was hired by the government to look into the stagnating
conditions in the local textile industry. One of the observations of the
foreign consultant was “Pakistan has failed to make real progress in the
international market and is being over taken by many of the neighboring
competitor
Countries. The
spinning sector, traditionally the core of the industry, is already in the
crisis with many spindles lying idle and mills being forced to close. Worse
still, this sector will be hit by the projected decline of its major markets in
Japan and Hong Kong in the coming years.” Another important strategic
recommendation given by the foreign consultant very much relevant to the
current.
Conditions:
“It is vital that companies play very positive role in the markets, which each
one having its own marketing activity, whose job is to understand the need of
the customers and the ever changing competitive dynamics of the markets. In
order to improve exports, Pakistan’s Readymade Garments Manufacturers and
Exporters Association (PRGMEA) has urged the commerce minister Abdul Razzak
Dawood to set up an Apparel Board for the promotion of export of woven and kit
garments which fetch US$ 2.5 billion foreign exchange for the country. The
industry experts are of the opinion that in the order to have a strong
industrial base, Pakistan economy need investment upswing. Pakistan’s economic
growth performance during recent years has been dismal: as against the average
growth rate of 6.1% in the 1980s, the half and 4.0% in the 2nd half of the
1990s. The major micro-economic instability factors like high inflation rate,
budgetary deficit, continuous depreciation of rupee, economic sanctions, etc.
could not help the investment process. Such an environment cannot be conducive
to investment and growth. Exporters of textile products have found the target
of US$ 10.4 billion set by the government for the year 2002-2003, as achievable
and termed it a realistic approach. The textile sector which constituted 69% of
total export during 2001-2002, believes that enhanced quota by the European
Union and Turkey would make this possible to fetch another US$1 billion this
year.
The
rise in export of value-added products from Pakistan was another point of
encouragement for the textile sector. “The export of value-added products rose
to 57.4% from 53.9% last year-a clear sign that we are moving in the right
direction, “said the Chairman of all Pakistan textile mills association. The
trade policy is considered an acceptable paper, but in the industry does not
fine anything that could lead to a high level exports achievement and remove
trade imbalance. Pakistan’s textile sector earned US$5.77 billion during the
outgoing year, compared with US$5.577 BILLION OF 2000-2001 indicating a growth
of 0.69%. “Textile
vision 2005” has
identified the present status and opportunities to make in roads in
conventional and hew markets and has developed sect oral recommendations, hence
the sect oral committees set up by the Federal Textile Board (FTB) would play
an important role be ensuring the availability of quality raw materials on
competitive prices and improvement in designing, and would adopt quality
standards and increase productivity levels. It would attract foreign brands and
promote Pakistani brands with world-class standers. With such a positive trend,
Pakistan’s textile sector is getting rid of old impediments and gearing itself
up for the new opportunities in the new trade regime.
TEXTILE USES
Textiles have an assortment of uses, the most common of
which are for clothing and containers such as bags and baskets. In the
household, they are used in carpeting, upholstered furnishings, window shades,
towels, covering for tables, beds, and other flat surfaces, and in art. In the
workplace, they are used in industrial and scientific processes such as
filtering. Miscellaneous uses include flags, backpacks, tents, nets, cleaning
devices, such as handkerchiefs; transportation devices such as balloons, kites,
sails, and parachutes; strengthening in composite materials such as fiber glass
and industrial geo textiles, and smaller cloths are used in washing by
"soaping up" the cloth and washing with it rather than using just
soap.
Textiles used for industrial purposes, and chosen for
characteristics other than their appearance, are commonly referred to as
technical textiles. Technical textiles include textile structures for
automotive applications, medical textiles (e.g. implants), geo textiles
(reinforcement of embankments), agro textiles (textiles for crop protection),
protective clothing (e.g. against heat and radiation for fire fighter clothing,
against molten metals for welders, stab
protection, and bullet proof vests. In all these applications stringent
performance requirements must be met. Woven of threads coated with zinc oxide
nanowires, laboratory fabric has been shown capable of "self-powering
nanosystems" using vibrations created by everyday actions like wind or
body movements.
TEXTILE VALUE CHAIN
INTRODUCTION OF ORGANIZATION
NISHAT GROUP
Mian Muhammad Mansha Yayha is the captain of this
splendid ship having around 30 companies on board. Mansha, who owns the Muslim
Commercial Bank as well, is now setting up a billion rupee ($ 17 m) paper sack
project too. He is one of the richest Pakistanis around. Nishat Group was
country's 15th richest family in 1970, 6th in 1990 and Number 1 in 1997. Mansha
is on the board of nearly 50 companies. Chinioti by clan, Mansha is married to
Yousaf Saigol's daughter.
He is deemed to have made investments in many bourses,
currency and metal exchanges both within and outside Pakistan. He has had his
share of luck on many occasions in life and has recently been awarded
Pakistan's highest civil award by President Musharraf. He could have bought the
United Bank too, but then who doesn't have adversaries. Nishat Group of
comprises of textiles, cement, leasing, insurance and management companies. If
Mansha was bitten by Bhutto's nationalization stint of 1970, his friends think
he was compensated by Nawaz Sharif's denationalization programme to a very good
effect. There is no stopping Mansha and he is still on the move!
The
history of Nishat Group dates back to 1951, when Mian Muhammad Yahya founded
Nishat Mills Limited. This man of vision, courage and integrity, Mian Mohammad
Yahya was born in 1918 in Chiniot. In 1947 when he was running leather business
in Calcutta, he witnessed by the momentous changes that swept the Indo-Pak
subcontinent. This is story of success through sheer hard work and an undaunted
spirit of enterprise. Beginning with a cotton export house, he soon branched
out in to ginning, cotton and jute textiles, chemicals and insurance. He was
elected Chairman of all Pakistan Textile Mills Association. He died in 1969 at the age of 51 having achieved so much in
so short time. After almost half a century of
Undaunted success, Nishat group is among the leading business houses of
the country and ranks among the top 5 groups in terms of assets and sales
revenue.
The group has its roots firmly planted into four core business namely.
- Textiles
- Power Generation
- Banking
- Cement
TEXTILES
The
textile business is further subdivided into 3-textile division:
- Nishat Lahore
- Nishat Faislabad
- Nishat Chunian
The
textile capacity of the group is the largest in the country. An addition of
20,000 new spindles, 100 new air jet looms and new dyeing plants has increased
the existing capacity of 242,000 spindles, 740 looms and dyeing and finishing
capacity of 5 million meters. The largest exporters of textile products from
Pakistan, for more then decade!
POWER GENERATION
Nishat
group has also been a pioneer in power generation in the private sector of the
country. Nishat setup the first power generation unit in the private sector in
1995.
CEMENT
In
1992, Nishat Group acquired D.G Khan Cement Company Limited (DGKCC) from the
second largest project of the group and is ideally located in the heart of the
country, with easy access to transportation all over Pakistan. DGKCC unit No. 1
has a capacity of 2,200 tons
per day. A new unit heaving the capacity of 3,300 tons
was setup in 1997. International Finance Corporation and common Wealth
Development Corporation have financed this unit. With the addition of unit
No.2, DGKCC has become the largest manufacturer of cement in Pakistan.
BANK
In 1991, Nishat Group ventured into the financial sector
through the acquisition of Muslim commercial Bank. MCB has grown ever since and
is now the largest bank in the private sector. MCB has a network of over 1200
branches employing over 12,000 people.
THE COMPANY
Nishat Mills Limited (“Nishat”) is a public company
incorporated in Pakistan under the Companies Act, 1913(Now Companies Ordinance,
1984) and listed on all three Pakistani stock exchanges. The Company is engaged
in the business of textile manufacturing and of spinning, combing, weaving,
bleaching, dyeing printing, stitching, buying, selling and otherwise dealing in
yarn, linen, cloth and other goods and fabrics made from raw cotton, synthetic
fiber and cloth, and to generate, accumulate, distribute and supply
electricity. Company is providing quality products to its customers within the
Pakistan and outside the Pakistan. Presently company is exporting its all kinds
if apparel products.
Major competitors Nishat competitors are
- Crescent
- Chenab
- Arzoo
- Alkarms
- Sitara
- Kohinoor
- Amtex
VISION STATEMENT
To transform the Company into a modern and
dynamic yarn, cloth and processed cloth and finished product manufacturing
Company with highly professionals and fully equipped to play a meaningful role
on sustainable basis in the economy of Pakistan.
To transform the Company into a modern an dynamic
power generating Company with highly professionals and full equipped to play a
meaningful role on sustainable basis in the economy of Pakistan.
MISSION STATEMENT
To provide quality products to customers and explore new markets to
promote/expand sales of The Company through good governance and foster a sound
and dynamic team, so as to achieve Optimum prices of products of the Company
for sustainable an equitable growth and prosperity Of the Company.
COMPANY PROFILE
CHIEF EXECUTIVE
- Mrs. Naz Mansha
BOARD OF DIRECTOR
- Mrs. Naz Mansha
- Mian Raza Mansha
- Mian Hassan Mansha
- Mr. Muhammad Nawaz Tishna (NIT)
- Mr. Faisal Ehsan Ellahi
- Mr. Khalid Qadeer Qureshi (Chief Financial Officer)
- Mr. Muhammad Azam
- Mr. Rana Muhammad Mushtaq
FINANCE DEPARTMENT
- Mr.Shehzad Malik (G.M)
- Mr.Usman Bajwa
- Mr.Badar Rauf
- Mr.Ashraf Ali Raza
- Mr.Inam
- Mr.Mudassar
- Mr.Asad Iqbal
- Mr.Masood Akhtar
- Mr.Nawaz
- Mr.Zulufiqar
AUDIT COMMITTEE
- Mr.waseem ul Haque Osmani Chairman
- Mian Hussan Mansha Member
- Mr. Aftab Ahmed Khan Member
HEAD OF INTERNAL AUDIT
- Mr.Khalid Kabeer
CORPORATE DEPARTMENT
- Mr. Muhammad Azam
- Mr.Khalid Mahmood Chohan
AUDITORS
- Riaz Ahmed & Company
Chartered Accountants
LEGAL ADVISOR
- Mr. M. Aurangzeb Khan, Advocate,
Chamber No. 6, District Court,
Faisalabad.
BANKERS TO THE COMPANY
- ABN AMRO Bank
- Allied Bank of Pakistan Limited
- American Express Bank Limited
- Askari Commercial Bank Limited
- Credit Agricole Indosuez
- Citibank N.A
- Deutsche Bank
- Faysal Bank Limited
- Habib Bank Limited
- Habib Bank A.G. Zurich
- Mashreq Bank P.S.C
- Meezan Bank Limited
- National Bank of Pakistan
- Standard Chartered Bank Grindlays
- The Hong Kong & Shangai
- Banking Corporation Limited
- Union Bank Limited
- United Bank Limited
MILLS
·
Niashatabad, Faisalabad (Spinning, Weaving,
Processing, Stitching units & Power Plant)12 K.M. Faisalabad
Road, Shiekhupura (Weaving units & Power Plant)
- 21 K.M Ferozepur Road, Lahore. (Stitching unit)
- 5 K.M. Nishat Avenue off 22 K.M Ferozepur Road, Lahore (Dyeing & Finishing Unit and Power Plant)
- 20 K.M. Shiekhupura Faisalabad Road, Froze Watwan (Spinning Unit)
ORGANIZATIONAL STRUCTURE
|
Strategic Analysis
Corporate level strategies
Nishat stands up to its social responsibilities both
in terms of environment and Welfare. The company covers
housing and medical expenses for its employees and also provides schooling
for their children. A high school has been opened for the children of the
employees and general public of the area. A hospital has been
constructed in the vicinity of the plant. The company also provides
recreational and sports facilities for the resident employees at the
production premises. NCL has also established a school
and hospital under the Mian Mohammad Yahya Trust, at a cost of
around US$ 700,000. The trust is sponsored by NCL and members of the sponsors
family. The high school opened in 2000 for the children of the employees and
general public of the area; has a staff of around 40 teachers
and offers education to 400 students. The hospital has also been
constructed in the vicinity of the plant; enabling local population to get
immediate medical attention instead of traveling to the nearest city. Around
80 patients are treated daily in the hospital by a staff of 30
people which includes 6 qualified doctors
Business Strategy
Aggressive marketing has been the major factor in our
consistent profitability over the past years. Our strategy is to remain at
the cutting edge in terms of exploring new markets and new products. The
focus is on niche marketing with specialized products. We have differentiated
our business through consistent quality, reliable delivery and proactive
handling of customer's needs.
Investment in state of the art technology and top quality
human resources has been key element of our business strategy. The
organizational structure is lean with very little hierarchy
and bureaucracy compared to other organizations of similar size. This
gives us the flexibility to respond quickly to the changes in the market
situation.
Functional Level Strategies:
1. FUNCTIONAL LEVEL STRATEGIES All organizations
irrespective of the size, nature and scope of business must perform the
functions like Marketing Finance Production & Operations Human Resource
Management Research & Development etc. Careful planning, execution and
coordination of these functions are highly essential for effective strategic
planning, implementation and control
2. FUNCTIONAL LEVEL STRATEGIES
Marketing Strategies • These strategies involves analysis, development and
implementation of activities • Marketing strategies can be studied under the
following areas Product and Service strategies Pricing Strategies Place /
Distribution Strategies Promotion Strategies
3. FUNCTIONAL LEVEL STRATEGIES
Marketing Strategies - Product and Service strategies Pricing Strategies The
above has been covered in Marketing II (First Year)
4. FUNCTIONAL LEVEL STRATEGIES Place
/ Channel of Distribution Strategies • This strategy depends upon whether the
company wants to sell directly or outsource its distribution function • Most
of the companies still prefer to distribute their products through market
intermediaries • Hence channel differentiation can be a distinctive
competitive advantage Egg. BSNL’s success is due to location of pay phones/STD
outlets even in corners of small towns and villages throughout India by
appointing agents
5. FUNCTIONAL LEVEL STRATEGIES
Promotion Strategies • This strategy includes advertising, personal selling
and sales promotion • Companies should have large advertising budgets during product
introduction stage in order to create customer acceptance • The companies
whose brand is enjoying a high market share can have a low advertising budget
• Companies however spend more on advertising in a highly competitive
environment
6. FUNCTIONAL LEVEL STRATEGIES
Pricing Strategies Please study the pricing strategies from any Marketing
Text Book Ramaswamy & Namakumari, Arun Kumar & N Meenakshi etc
7. FUNCTIONAL LEVEL STRATEGIES
Financial Strategies • Finance is a fundamental resource for starting and
conducting of a business • Financial strategies are centered around acquiring
capital, reducing cost capital etc. • Also making complex investment
decisions through capital budgeting financing and dividend decisions capital
structure working capital strategies in terms of accounts receivables,
inventories, cash flow management etc.
8. FUNCTIONAL LEVEL STRATEGIES
Acquiring Capital • Capital can be equity capital and loan capital / debt
capital • Equity capital provides security and free from paying interest and
financial risk • Debt capital although requires the payment of fixed interest
regularly, it provides huge surplus during business boom • Companies thus
decide to have both equity and debt capital
9. FUNCTIONAL LEVEL STRATEGIES
Capital Structure Strategy • Capital structure is a mix of equity capital,
preference capital, retained earnings and debt capital • Companies formulate
optimum capital structure strategy in order to balance the advantages and
disadvantages/ risks • Optimum capital structure possesses the following
features
10. FUNCTIONAL LEVEL STRATEGIES
Features of Optimum Capital Structure • Generation of maximum rate of return
on capital employed for the purpose of maximization of wealth of equity
shareholders • Excessive debt capital results in risk of solvency of the
company hence they should limit the debt capital at a point where the risk
begins • Companies should adopt a flexible structure in order to adapt the
structure to the economic situations • The amount of debt capital should be
within the capacity of the company to generate future cash flows • Capital
structure of the company should result in control of risk in debt capital
11. FUNCTIONAL LEVEL STRATEGIES
Dividend Strategy • This is to decide the amount of profits to be distributed
to he shareholders after retaining certain amount of profits as a surplus •
This is for the future investment of the company and earning benefit to the
shareholder • In turn this enables the company ton generate the capital for
future investment purpose which involves the least cost of capital as well as
risks • Dividend strategy is to maximize the shareholders return in the long
run by maximizing the value of investment • Thus dividend strategy balances
the current returns and capital gains
12. FUNCTIONAL LEVEL STRATEGIES
Human Resource Strategies • This is the critical, dynamic and living resource
of an organ. Unlike other resources • HRM strategies percolate into other
functional strategies and integrates all of them towards corporate and
business level strategies • HRM is managing the functions of employing,
developing, compensating and utilizing human resources • This results in
development of human and industrial relations which would shape the future
policies and practices of human resource management • This is with a view to
contribute proportionately to the organizational, individual and social goals
13. FUNCTIONAL LEVEL STRATEGIES
Objectives of Human Resource Management • To create and utilize an able and motivated
workforce and to accomplish the basic organizational goals • To establish and
maintain sound organizational structure and desirable working relationships
among all members of the organization • To secure the integration of an
individual and groups within the organization by co-ordination of the
individual and group goals with those of the organization • To create
facilities and opportunities for an individual or group development so as to
match it with the growth of the organization
14. FUNCTIONAL LEVEL STRATEGIES
Objectives of Human Resource Management • To create and utilize an able and
motivated workforce and to accomplish the basic organizational goals • To
establish and maintain sound organizational structure and desirable working
relationships among all members of the organization • To secure the
integration of an individual and groups within the organization by
co-ordination of the individual and group goals with those of the
organization • To create facilities and opportunities for an individual or
group development so as to match it with the growth of the organization • To
satisfy individual and group needs by providing adequate and equitable wages,
incentives, employee benefits and social security
15. FUNCTIONAL LEVEL STRATEGIES
Organization Structure and HRM Strategies • Recent development in the
organizational structure is the virtual structure • Virtual organizations is
a social network in which all the horizontal and vertical boundaries are
removed • It consists of individuals working out from physically dispersed
workplaces or individuals working from mobile devices and not confined to any
particular workplace • It is a coordinated intense structure consisting
primarily of patterns and relationships, and this form needs the
communication and information technology to function
16. FUNCTIONAL LEVEL STRATEGIES
Organization Structure and HRM Strategies • Limited number of employees
coordinate the function and activities of various outsourced agencies •
Combine human skills, financial resources, marketing /customer needs,
advertising agencies, innovations etc. • This is done with the help of
communication and information technology • A network of relationships
coordinates the manufacturing, financing, human resourcing, marketing and
other activities • There are partial and virtual organizations • They
physically perform some activities and outsource the remaining activities •
BATA physically markets its products and outsources the manufacturing
activities
17. FUNCTIONAL LEVEL STRATEGIES
Characteristics of Virtual Organizations Flexi-work, Flexi-time and
Flexi-work place Part-time work Job sharing Home based working Dependency on
Information Technology like e-mail integration, mobile phone network,
computer-telephony integration etc. Loose organization boundaries De-jobbing
Multi-skilling Flexibility in power work Goal directed Customer centered
18. FUNCTIONAL LEVEL STRATEGIES
Human Resource Trends in Virtual Organizations • Organization’s human
resources are the loose web of people • Knowledgeable people are hired for
short term projects • Autonomy of work but accountable to the targets,
performance etc. • Employees can work from home or from any other place •
Social and work environment do not draw much attention of the HR manager •
Career planning and development are based on projects • Selection of
employees is based not only on technical skills but also on their ability to
work in teams or independently • Emotional and attitudinal quotient (EAQ) is
the prime factor in employee selection rather than intelligent quotient(IQ)
19. FUNCTIONAL LEVEL STRATEGIES
Strategic Management and Performance Appraisal • Just like HRM practices
Performance Appraisal practices also depends upon the strategy adopted by the
company • Traditional techniques of performance appraisal are appropriate for
the stability and sustainable growth strategies • Appraisal by the superior
is appropriate for these strategies • Modern performance appraisal techniques
are suitable for growth strategies like expansion, diversification, joint
ventures, mergers and acquisitions • Performance appraisal by the customers,
subordinates and peers in addition to the superiors help employees to have a
feedback from multiple directions • This helps in identifying deficiencies
and acquire competencies through training and development • This along with
the 360 degree performance appraisal enhance employee creativity that
contributes to achievements like new product development, low cost leadership
and differentiation strategies
20. FUNCTIONAL LEVEL STRATEGIES
Strategic Management and Performance Appraisal Team Training • Organizations
mostly rely on team work and team management to achieve goals • This is more
prevalent in activities like production, marketing, customer relationship,
supply chain and finance • Teamwork results in synergy and produces greater
efficiency for organizational success
21. FUNCTIONAL LEVEL STRATEGIES
Strategic Management and Performance Appraisal Diversity Training • Number of
employees from varying ethnic groups as well as diverse background has been
increasing • This brings varied knowledge that helps the organization in
making accurate and efficient decisions • Organizations need to provide
diversity training in order to get the advantage of diversity
22. FUNCTIONAL LEVEL STRATEGIES
Strategic Management and Performance Appraisal Retention Management •
Employers prefer to retain more talented employees while they retrench less
talented employees • Employers modify the existing HR strategies and craft
new strategies in order to pay more salaries, provide more benefits and
create high quality of work life to retain the best employees
23. FUNCTIONAL LEVEL STRATEGIES
Strategic Management and Performance Appraisal Total Quality Human Resources
• Total Quality is defined as: “ A people focused management system that aims
at continual increase in customer satisfaction at continually lower cost.
Total Quality is a total system approach and an integral part of high level
strategy It works horizontally across functions and departments involving all
employees top to bottom and extends backwards and forwards to include the
supply chain and customer chain”
24. FUNCTIONAL LEVEL STRATEGIES
Strategic Management and Performance Appraisal Total Quality Management • It
is a continuous process of improvement for individuals, groups of people and
total organization • Unlike other methods TQM is concentrated focus on
continuous improvement • It is about changing ways things are done within the
organizations lifetime • People must know what to do, how to do it and have
the right methods to do it • People should be able to measure the improvement
of the process and the current level of achievement in order to improve the
process
Swot Analysis
SWOT analysis is a simple framework for generating
strategic alternatives from a situation analysis. It is applicable to either
the corporate level or the business unit level and frequently appears in
marketing plans. SWOT (sometimes referred to as TOWS) stands for Strengths,
Weaknesses, Opportunities, and Threats .A scan of the internal and external
environment is an important part of the strategic planning process.
Environmental factors internal to the firm usually can be classified as
Strengths
(S)Weaknesses (W),
And those external to the firm can be classified as
Opportunities (O) Threats (T).
Such an analysis of the strategic environment is
referred to as a SWOT analysis .The outcome from a SWOT Analysis enables
organizations to focus on strengths,
minimizeweaknesses, address threats, and take the greatest possible advantage of opportunitiesavailable.
The SWOT Matrix
A firm should not necessarily pursue the more lucrative
opportunities. Rather, it may have a better chance at developing a
competitive advantage by identifying a fit between the firm'sstrengths and
upcoming opportunities. In some cases, the firm can overcome a weakness
inorder to prepare itself to pursue a compelling opportunity. To
develop strategies that take into account the SWOT profile, a matrix of these
factors can deconstructed. The SWOT matrix (also known as a TOWS Matrix) is
shown below
|
Swot strategies pursue opportunities that are a good fit to the company's strengths.Swot strategies overcome weaknesses to pursue opportunities.S-T strategies identify ways that the firm can use its strengths to reduce its vulnerabilityto
external threats. strategies establish a defensive plan to prevent the firm's weaknesses from making ithighly
susceptible to external threats.
SWOT ANALYSIS OF NISHAT Strengths
NCL’s strengths are its resources and capabilities
that can be used as a basis for developing a competitive
advantage. Nishat Group is the largest group in Pakistan in terms of sales, which wereapproximately
Rs.16 billion (US$ 400 million equivalent) last year. NCL is in
businesses namely power generation and textile.Our textile division, Nishat Chunian has a spinning capacity of 144,803 spindleslocated
in 5
units.Due to having setups at difference locations, we have a benefit of utilizinginfrastructure
like roads, electricity load, BMR etc The product range is 100% cotton yarn, ranging
from 6/1 to 30/1 in carded yarns and from 12/1 to 100/1 in combed yarns.
In addition to the above we are also in core spun stretch yarns of 2 and 3 ply
yarns and slab yarns. The total capacity is 59 million of slab yarn per annum.
The weaving capacity is 293 air jet looms wider width. The fabric is being
exported to various companies in Hong Kong, Japan, Korea, USA, South Africa,
India and Europe .The company believes in product innovation and has
successfully leveraged its strength in yarn manufacturing to make
a variety of fabrics.
EFE Matrix (External Factor
Evaluation)
External Factor Evaluation (EFE) matrix method is a
strategic-management tool often used for assessment of current business
conditions. The EFE matrix is a good tool to visualize and prioritize the
opportunities and threats that a business is facing.
The EFE matrix is very similar to the IFE matrix. The major difference between
the EFE matrix and the IFE matrix is the type of factors that are included in
the model. While the IFE matrix deals with internal factors, the
EFE matrix is concerned solely with external factors.
External factors assessed in the EFE matrix are the
ones that are subjected to the will of social, economic, political, legal, and
other external forces
How do I create the EFE matrix?
Developing an EFE matrix is an intuitive process which works
conceptually very much the same way like creating the IFE matrix. The EFE
matrix process uses the same five steps as the IFE matrix.
List factors:
The first step is to gather a list
of external factors. Divide factors into two groups: opportunities
and threats.
Assign weights
Assign a weight to each factor. The value of each
weight should be between 0 and 1 (or alternatively between 10 and 100 if you
use the 10 to 100 scale). Zero means the factor is not important. One or
hundred means that the factor is the most influential and critical one.
The total value of all weights together should equal 1 or 100.
Rate factors
Assign a rating to each factor. Rating should be between 1
and 4. Rating indicates how effective the firm’s current strategies respond to
the factor. 1 = the response is poor. 2 = the response is below average. 3 =
above average. 4 = superior. Weights are industry-specific. Ratings are
company-specific.
Multiply weights
by ratings
Multiply each factor weight with its rating. This
will calculate the weighted score for each factor.
Total all weighted
scores:
Add all weighted scores for each factor. This
will calculate the total weighted score for the company.
You can find more details about this approach as well as
about possible values that the EFE matrix can take on the IFE matrix page.
EFE matrix example
What should I include in the EFE matrix?
Now that we know how to construct or create the EFE matrix,
let's focus on factors. External factors can be grouped into the following
groups:
Social, cultural, demographic, and environmental variables:
Economic variables
Political, government, business trends, and legal variables
Below you can find examples of some factors that
capture aspects external to your business. These factors may not all apply to
your business, but you can use this listing as a starting point.
Social, cultural, demographic, and environmental factors
- Aging population
- Percentage or one race to other races
- Per-capita income
- Number and type of special interest groups
- Widening gap between rich & poor
- Number of marriages and/or divorces
- Ethnic or racial minorities
- Education
- Trends in housing, shopping, careers, business
- Number of births and/or deaths
- Immigration & emigration rates
Economic factors
- Growth of the economy
- Level of savings, investments, and capital spending
- Inflation
- Foreign exchange rates
- Stock market trends
- Level of disposable income
- Import and export factors and barriers
- Product life cycle (see the Product life cycle page)
- Government spending
- Industry properties
- Economies of scale
- Barriers to market entry
- Product differentiation
- Level of competitiveness (see the Michael Porter's Five Forces model)
Political, government, business trends & legal
factors...
- Globalization trends
- Government regulations and policies
- Worldwide trend toward similar consumption patterns
- Internet and communication technologies (e-commerce)
- Protection of rights (patents, trade marks, antitrust legislation)
- Level of government subsidies
- International trade regulations
- Taxation
- Terrorism
- Elections and political situation home and abroad
International Financial Institutions (IFI) Matrix
Why are international financial institutions important?
The International Financial Institutions (IFIs) include the
World Bank, the regional development banks, and the International Monetary Fund
(IMF). They are the largest source of development finance in the world,
typically lending between US$30-$40 billion to low and middle-income countries
each year.
The IFIs, and in particular the World Bank, are a primary
source of development knowledge, publishing research that frames the debate on
development issues. Other donor institutions often take their lead from the
World Bank and the IMF, thus amplifying the impact of those institutions’
lending approaches and decisions.
IFI loans to finance investment projects and policy reforms
in developing countries are intended to reduce poverty and encourage economic
development. However, ill-conceived IFI loans have often caused widespread
environmental and social damage including irreversible impacts on natural
habitats, displaced communities, and indigenous peoples.
IFI activities are often carried out without the informed
participation of affected people, non-governmental organizations (NGOs), and-in
many cases-even the legislatures of the Banks’ borrowing countries. Moreover,
despite some progress the IFIs still do not release comprehensive information
in a timely manner during project design and implementation. Finally, as
publicly financed institutions, the IFIs should be held accountable for the
consequences of the funds they loan to developing countries.
Why are international financial institutions important?
The International Financial Institutions (IFIs) include the
World Bank, the regional development banks, and the International Monetary Fund
(IMF). They are the largest source of development finance in the world,
typically lending between US$30-$40 billion to low and middle-income countries
each year.
The IFIs, and in particular the World Bank, are a primary
source of development knowledge, publishing research that frames the debate on
development issues.
IFI loans to finance investment projects and policy reforms
in developing countries are intended to reduce poverty and encourage economic
development. However, ill-conceived IFI loans have often caused widespread
environmental and social damage including irreversible impacts on natural
habitats, displaced communities, and indigenous peoples.
IFI activities are often carried out without the informed
participation of affected people, non-governmental organizations (NGOs), and-in
many cases-even the legislatures of the Banks’ borrowing countries. Moreover,
despite some progress the IFIs still do not release comprehensive information
in a timely manner during project design and implementation. Finally, as
publicly financed institutions, the IFIs should be held accountable for the
consequences of the funds they loan to developing countries.
BCG Matrix
Any business knows that, to survive, it has to have products
that bring in money now and products that will bring in money in the future,
and identify which products are a drain on resources without potential to come
back. While it's easy to identify the profitable products, determining how the
rest of your portfolio fits into the growth scheme can be harder. The BCG
matrix was designed as an analysis tool to help you determine the role of
products on your future profit margin so you can decide where to invest.
Creating your
matrix
First, you'll need data on the market share and growth rate
of your products or services. When examining market growth, you need to
objectively compare yourself to your largest competitor and think in terms of
growth over the next three years. If your market is extremely fragmented,
however, you can use absolute market share instead, according to the Strategic Thinker blog.
Next, you can either draw a matrix or find a BCG chart
program online. (There are several that are free, available for subscription or
part of another charting program.) In this four-quadrant chart, market share is
shown on the horizontal line (low left, high right) and growth rate along the
vertical line (low bottom, high top). The four quadrants are designated
"stars" (upper left), "question marks" (upper right),
"cash cows" (lower left) and "dogs" (lower right).
Place each of your products into the appropriate box based
on where they rank in market share and growth. Where you choose to set the
dividing line between each quadrant depends in part on how your company
compares to the competition. Here is a breakdown of each quadrant:
Stars: The business units or products that have the
best market share and generate the most cash are considered stars. Monopolies
and first-to-market products are frequently termed stars. However, because of
their high growth rate, stars also consume large amounts of cash. This
generally results in the same amount of money coming in that is going out.
Stars can eventually become cash cows if they sustain their success until a
time when the market growth rate declines. Companies are advised to invest
in stars.
Cash cows: Cash cows are the leaders in the marketplace
and generate more cash than they consume. These are business units or products
that have a high market share but low growth prospects. According to Net MBA,
cash cows provide the cash required to turn question marks into market leaders,
cover the administrative costs of the company, fund research and development,
service the corporate debt, and pay dividends to shareholders. Companies are
advised to invest in cash cows to maintain the current level of productivity,
or to "milk" the gains passively.
Dogs: Also known as pets, dogs are units or products
that have both a low market share and a low growth rate. They frequently break
even, neither earning nor consuming a great deal of cash. Dogs are generally
considered cash traps because businesses have money tied up in them, even
though they are bringing back basically nothing in return. These business units
are prime candidates for divestiture.
Question marks: These parts of a business have high
growth prospects but a low market share. They consume a lot of cash but bring
little in return. In the end, question marks, also known as problem children,
lose money. However, since these business units are growing rapidly, they do
have the potential to turn into stars. Companies are advised to invest in
question marks if the product has potential for growth, or to sell if it does
not.
TOWS Matrix
TOWS Matrix
Definition
The TOWS matrix analysis
(Threats-Opportunities-Weaknesses-Strengths) also known as SWOT Analysis. We may also call the TOWS matrix, TOWS
Analysis. It is the abbreviation of threats, opportunities, strengths &
weaknesses involved in a business venture, project or any other situation that
needs a decision, are evaluated with the help of strategic planning tool of
TOWS matrix analysis.
How to work effectively with the
company’s strengths?
- How to overcome the weaknesses?
- Embrace some advantage of the opportunities?
- How to handle the threats?
- How to overcome the weaknesses?
- Embrace some advantage of the opportunities?
- How to handle the threats?
The TOWS MATRIX does not only provide a list of strengths
,weaknesses ,threats and opportunities but works as a matching tool that helps
to make a pair of internal and external factors to bring out better solutions
in the current scenario of a company. The marketers/managers do not only
evaluate the four strategies but strives how to match together all the external
and internal factors to execute them in a best possible way.
According to Michael Watkins of Harvard Business Review , by
focusing on the external factors i.e. the threats and opportunities at first
can lead to a more productive outcome that elucidate what’s happening in the
external settings rather to lay emphasis on the internal capabilities of a
company.
THE TOWS MATRIX can be explained as the following:
1- STRENGTHS:
Those attributes that makes the company stronger against its
competitors and can be effective to achieve the desired objective. For example,
a company who has the highest market share or produce the highest quality of a
product against its rivals.
2- WEAKNESSES:
Those internal factors that can be risky for the company to
achieve success in the future. For example: A company who possess an outdated
technology and lacks innovation in products.
3- OPPORTUNITIES:
Those external conditions that can be helpful towards the
attainment of the objective. For example: the new economic growth or the
social changes in the environment might be an advantage for a company.
4- THREATS:
Those external settings that could be risky and harmful
towards achieving the objective. For example: Changes in the consumer buying
patterns or the competitor may come up with a product which has been more in
demand.
The TOWS MATRIX helps to identify the strategic alternatives
for a company that works as a matching tool by constructing four types of
strategies such as:
- THE SO STRATEGY:
This is also known as Maxi –Maxi Strategy where a firm
utilizes most of its internal strengths in order to grab the right external
opportunities. For instance: A firm whose financial position is quite strong
and posses low market share is able to introduce many innovative products in
the market by making investment in the Research & development Department of
the firm.
Mercedes Benz takes advantage of the external demand of
their lavish vehicles and makes right use of the technical skills and quality
of their products.
- THE WO STRATEGY:
The WO STRATEGY is also known as Mini- Maxi Strategy that
can be used to overcome the weaknesses of a company by taking advantage of the
opportunities, For instance: A firm who lacks skilled workers can utilize the
opportunity by updating new technology in order to increase production. The
internal weaknesses of any firm can also be improved by recruiting and training
employees through learning additional technical skills.
A company who faces a decline in the financial sector can
avail the opportunity of merging with a multinational company.
- THE ST STRATEGY:
The ST Strategy / Maxi-Mini Strategy is where a company
through its strengths can avoid any kind of external threats. Any organization
can refrain from external threats by avoiding any copied ideas, innovation in
products of another organization. In a case with an organization that possess
good quality of products but is facing threats against competitors who offers
low priced products can adopt ST strategy by mass production of the products,
therefore it will reduce the unit cost of production.
- THE WT STRATEGY:
The WT Strategy Or Mini- Mini Strategy are adopted by firms
who needs to reduce the level of weaknesses and avoids any external threats at
the same time This can be considered as a defensive technique in a situation
where a company whose financial position is at the critical stage and the
demand of its product getting reduced, the only possible chance to sustain
itself in the market is to adopt a retrenchment strategy or decides for merger
with an another company.
However, The WT Strategy is difficult to implement in a
situation with a company whose distribution channel tends to be weak, if it
gets improved by chance, in that case it will be able to remove many external
threats easily.
Following are the steps to construct a TOWS Matrix:
1- You need to identify and make a list of
all the existing strengths of the organization.
2- Identify and list down the most
important weaknesses of the organization.
3- List down all the external threats that
are faced by the organization.
4- Similarly, make a list of all the
opportunities that can be advantageous for the organization.
5- Now, to implement the SO strategy in
the SO cell, you need to match the appropriate internal strengths with external
opportunities.
6- In the same way, match the right
internal weaknesses with external opportunities and type the correct WO
strategy in the WO cell.
7- Similarly, make a match of internal
strengths with external threats to type the right ST Strategy in the respective
ST cell.
8- Match all internal weaknesses with
external threats to construct the appropriate WT strategy.
Quantitative Strategic Planning
Matrix
Quantitative Strategic Planning Matrix (QSPM) is a
high-level strategic management approach for evaluating possible
strategies. Quantitative Strategic Planning Matrix or a QSPM provides
an analytical method for comparing feasible alternative actions.
The QSPM method falls within so-called stage 3 of the strategy
formulation analytical framework.
The Quantitative Strategic Planning Matrix is a strategic
tool which is used to evaluate alternative set of strategies. The QSPM
incorporate earlier stage details in an organize way to calculate the score of
multiple strategies in order to find the best match strategy for the organization.
The Quantitative
Strategic Planning Matrix (QSPM)
Step 1
Make a list of the firm’s key external opportunities/threats
and internal strengths/weaknesses in the left column of the QSPM. This
information should be taken directly from the EFE Matrix and IFE Matrix. A
minimum of 10 external critical success factors and 10 internal critical
success factors should be included in the QSPM.
Step 2
Assign weights to each key external and internal factor.
These weights are identical to those in the EFE Matrix and the IFE Matrix. The
weights are presented in a straight column just to the right of the external
and internal critical success factors.
Step 3
Examine the Stage 2 (matching) matrices and identify
alternative strategies that the organization should consider implementing.
Record these strategies in the top row of the QSPM. Group the strategies into
mutually exclusive sets if possible.
Step 4
Determine the Attractiveness Scores (AS), defined as
numerical values that indicate the relative attractiveness of each strategy in
a given set of alternatives. Attractiveness Scores are determined by examining
each key external or internal factor, one at a time, and asking the question,
“Does this factor affect the choice of strategies being made?” If the answer to
this question is yes, then the strategies should be compared relative to that
key factor. Specifically, Attractiveness Scores should be assigned to each
strategy to indicate the relative attractiveness of one strategy over others,
considering the particular factor. The range for Attractiveness Scores is 1 =
not attractive, 2 = somewhat attractive, 3 = reasonably attractive, and 4 =
highly attractive. If the answer to the above question is no, indicating that
the respective key factor has no effect upon the specific choice being made,
then do not assign Attractiveness Scores to the strategies in that set. Use a
dash to indicate that the key factor does not affect the choice being made.
Note: If you assign an AS score to one strategy, then assign AS score(s) to the
other. In other words, if one strategy receives a dash, then all others must
receive a dash in a given row.
Step 5
Compute the Total Attractiveness Scores. Total
Attractiveness Scores are defined as the product of multiplying the weights
(Step 2) by the Attractiveness Scores (Step 4) in each row. The Total
Attractiveness Scores indicate the relative attractiveness of each alternative
strategy, considering only the impact of the adjacent external or internal
critical success factor. The higher the Total Attractiveness Score, the more
attractive the strategic alternative (considering only the adjacent critical
success factor).
Step 6
Compute the Sum Total Attractiveness Score. Add Total
Attractiveness Scores in each strategy column of the QSPM. The Sum Total
Attractiveness Scores reveal which strategy is most attractive in each set of
alternatives. Higher scores indicate more attractive strategies, considering
all the relevant external and internal factors that could affect the strategic
decisions. The magnitude of the difference between the Sum Total Attractiveness
Scores in a given set of strategic alternatives indicates the relative
desirability of one strategy over another.
Porter’s five forces Model
The five forces model is the framework for
analyzing determinants of industry profitability. It is used to identify the
threats and opportunities confronting a company that is thinking of entering
into a particular industry. The model focuses on five
particular forces that Porter says shape the competition
that is in each particular industry. Rivalry among established firms is
the central focus that is surrounded by the threat of potential entrants and
substitute technologies, as well as bargaining power of buyers and suppliers.
The first of Porter's five forces is the extent of rivalry among
established firms in the industry. If there is strong rivalry in the industry,
then competition will be fierce and profits will be limited. This will also
limit other potential firms from entering the market. The second of
the forces listed is the threat of potential entrants into the
industry. These are the companies that are not currently in the industry but
have the resources to enter the industry at any time. This is a threat because
it is another company that can potentially take away market share. The
third force that Porter mentions is the threat of
substitute technologies. These are substitute products that can serve the
industry as a replacement to the current technology. This is a threat because if
a firm.
It is every strategist’s job to evaluate company’s competitive
position in the industry and to identify what strengths or
weakness can be exploited to strengthen that position. The tool is very useful
in formulating firm’s strategy as it reveals how powerful each of the five key
forces is in a particular industry.
Threat of new entrants. This force determines how easy
(or not) it is to enter a particular industry. If an industry is profitable and
there are few barriers to enter, rivalry soon intensifies. When more
organizations compete for the same market share, profits start to fall. It is
essential for existing organizations to create high barriers to enter to deter
new entrants. Threat of new entrants is high when:
Low amount of capital is required to enter a market;
Existing companies can do little to retaliate;
Existing firms do not possess patents, trademarks or do not
have established brand reputation;
There is no government regulation;
Customer switching costs are low (it doesn’t cost a lot of
money for a firm to switch to other industries);
There is low customer loyalty;
Products are nearly identical;
Economies of scale can be easily achieved.
Bargaining power of
suppliers. Strong bargaining power allows suppliers to sell higher priced
or low quality raw materials to their buyers. This directly affects the buying
firms’ profits because it has to pay more for materials. Suppliers have strong
bargaining power when:
There are few suppliers but many buyers;
Suppliers are large and threaten to forward
integrate;
Few substitute raw materials exist;
Suppliers hold scarce resources;
Cost of switching raw materials is especially high.
Bargaining power of
buyers. Buyers have the power to demand lower price or higher product
quality from industry producers when their bargaining power is strong. Lower
price means lower revenues for the producer, while higher quality products
usually raise production costs. Both scenarios result in lower profits for
producers. Buyers exert strong bargaining power when:
Buying in large quantities or control many access points to
the final customer;
Only few buyers exist;
Switching costs to other supplier are low;
They threaten to backward
integrate;
There are many substitutes;
Buyers are price
sensitive.
Threat of substitutes. This
force is especially threatening when buyers can easily find substitute products
with attractive prices or better quality and when buyers can switch from one
product or service to another with little cost. For example, to switch from
coffee to tea doesn’t cost anything, unlike switching from car to bicycle.
Rivalry among existing competitors. This force is the
major determinant on how competitive and profitable an industry is. In
competitive industry, firms have to compete aggressively for a market share,
which results in low profits. Rivalry among competitors is intense when:
There are many competitors;
Exit barriers are high;
Industry of growth is slow or negative;
Products are not differentiated and can be easily
substituted;
Competitors are of equal size;
Low customer loyalty.
Although, Porter originally introduced five forces affecting
an industry, scholars have suggested including the sixth
force: complements. Complements increase the demand of the primary product
with which they are used, thus, increasing firm’s and industry’s profit
potential. For example, iTunes was created to complement iPod and added value
for both products. As a result, both iTunes and iPod sales increased,
increasing Apple’s profits.
Chart of strategic business unit
Strategic Business Unit (SBU) implies an independently
managed division of a large company, having its own vision, mission and
objectives, whose planning is done separately from other businesses of the
company. The vision, mission and objectives of the division are both distinct
from the parent enterprise and elemental to the long-term performance of the
enterprise.
Simply put, an SBU is a cluster of associated
businesses which are responsible for its combined planning treatment, i.e.
the company engaged in a diversified range of businesses, categorises its
multitude of businesses into a few separate divisions, in a scientific way. The
task may include analysis and bifurcation of a variety of businesses.
It can be a business division, a product line of
the division or even a specific product/brand, targeting a particular
group of customers or a geographical location.
Characteristics of Strategic Business Unit
Separate business or a grouping of similar businesses,
offering scope for autonomous planning.
Own set of
competitors.
A manager who is accountable for strategic planning,
profitability and performance of the division.
A strategic business unit is specially formed to target a
particular market segment, which requires expertise in production or
management, not present in the parent company.
Strategic Business Unit Structure
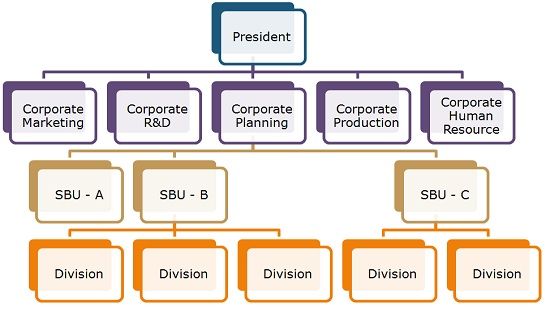
The structure of SBU consist of operating units;
wherein the units serve as an autonomous business. The top corporate officer
assigns the responsibility of the business to the managers, for the regular
operations and business unit strategy. So, the corporate officer is accountable
for the formulation and implementation of the comprehensive strategy and
administers the SBU by way of strategic and financial controls.
In this way, the structure combines related divisions of
business into the strategic business unit and the senior executive is empowered
for taking decisions for each unit. The senior executive works under the
supervision of a chief executive officer.
There are three levels in a strategic business
unit, wherein the corporate headquarters remain at the
top, SBU’s in the middle and divisions clustered by similarity,
within each SBU, remain at the bottom. Hence, the divisions within
the SBU are associated with each other, and the SBU groups are independent of
each other. From the strategic viewpoint, each SBU is an independent business.
A single strategic business unit is considered as
a profit centre and governed by the corporate officers. It
stresses over strategic planning instead of operational control so that the
separate divisions of the SBU can respond as fast as they can, to the changing
business environment.
Issues in current strategies
The Key focus directed to any organization is geared by
issues in the economic view of the trending world's economy. The organizations
need to address specific industry related trends in the strategic
management.
Maintaining a focus on the global outlook of the firm's
growth strategies and an extensive focus on the technological needs of the firm
and trends within the industry.
Main concern is addressing challenges faced within the firms
operations such as low-income segments. Some issues to address
Corporate Strategy - The Core Concepts
Succeeding in highly competitive sectors
Balancing a social focus in a commercial setting
Evolving products and delivery channels
Reaching new business segments
Competitive Dynamics
Putting it All Together
Corporate Philosophy and Culture
General Principles of Organization Design
Knowledge management and Data analysis of various data sets.
Quality control and Assurance
Risk management arising within the organization and those
that arise other than organizational risks.
Addressing this issues its paramount that firms will be able
to improve their service delivery as well as revolutionalize the
industry.
Proposed Recommendations
I would
suggest or recommend to NML the following things, which they should be
implemented at NML.
- At NML, such bonus facilities are
given only to production department. In my point of view, they should
provide these such bonus facilities other departments as well, this act
will increase the loyalty of their officers and employees towards NML and
it also can be motivating factor as well for them.
- Most important in my point of view
that NML has policy of not to give any stipend to the internees. I think
they should give some stipend to the trainees, this will encourage new
trainees to come here and this will also boost up their energies and they
will work with more interest.
- At NML, salary packages are not so
good, that’s why employee turnover rate is slightly higher. I suggest them
that they should provide good salary packages to their officers and
employees for retaining them for the longer period.
- Favoritism should be eliminated
and the recruitment should be done on purely merit basis.
- Decentralization of authority
should be there. With the active participation of all the management,
level employees in the decision-making will be fruitful for NML.
- Proper training at each level
should be given to the employees.
- Special bonuses and incentives
such as on Eid days should give to the employees.
- NML should hire trained and highly
qualified young professionals.
- NML should try to reduce their
financial expenses.
- The suppliers should be encouraged
to supply NML manufactured items to consumers.
- The bargaining power of the buyers
or customers, their traditions, income and living standard should examine.
- The company should keep a close
watch on costs in areas such as research and development, sales and
services. The company may try to
have low cost structure compared with that of it’s competitors.
- Promotion in lower and middle
level is usually based on age not on performance. Rate of promotion is
also slow. So the employees feel dissatisfaction.
- Every one at NML should be agree
to follow three fundamental principles; respect individuals, strive for
excellence, and provide the best service.
- Upper management should encourage
the existing employees to go for further training and special education;
in near future it will be beneficial for the company.
Conclusions:
It was a wonderful and learning experience for us while working on this project .Took us the various
phases of project development and give us real insight into the world of Cotton
industry ,The joy of working and thrill while tackling the various problems and
challenges gave us a feel of cotton
industry .
It was due to this project
we came to know how cotton industry in working nationally and
internationally .
We enjoyed etch and every bit of work we had put into this
project .The project further extendable.
REFERENCES
- Mr. Rizwan Aslam Manager Export Marketing
- Mr. Faizan, Marketing officer
- Mr. Muneer, Accounts Manager
http://www.nishatmillsltd.com/nishat/company-profile.htm
www.Google.com
http://www.businessnewsdaily.com/5693-bcg-matrix.html
http://www.mba-tutorials.com/strategy/1738-tows-matrix.html
https://i0.wp.com/www.business-to-you.com/wp-content/uploads/2017/02/TOWS-Matrix.png
https://image.slidesharecdn.com/amazonpresentation-130117223502-phpapp01/95/amazon-strategic-management-7-638.jpg?cb=1358462282
http://www.soopertutorials.com/business/strategic-management/1568-quantitative-strategic-planning-matrix-qspm.html
http://businessjargons.com/strategic-business-unit.html#ixzz4qCIOp8Mz
https://www.strategicmanagementinsight.com/tools/porters-five-forces.html
(http://ec.europa.eu/justice/discrimination/diversity/charters/index_en.htm)
https://www.projectsmart.co.uk/img/swot-analysis.png
It's a magnificent blog and it was very informative while reading. I look forward to reading more of your blogs. More info please visit:
ReplyDeletehttps://indusdesignworks.com/architectural-designer.php
Freelance architectural design
All the contents you mentioned in post is too good and can be very useful. I will keep it in mind, thanks for sharing the information keep updating,
ReplyDeleteRent a Car Islamabad to Lahore